


Annual Report 2017-18
Niobrara Public School
54-0501-000
2017-2018 Annual Report
Contact Information:
Niobrara Public School
247 N. Hwy 12
Niobrara, NE 68760-0310
Phone: 402-857-3322
Fax: 402-857-3716
Agency ID: 54-0501-000
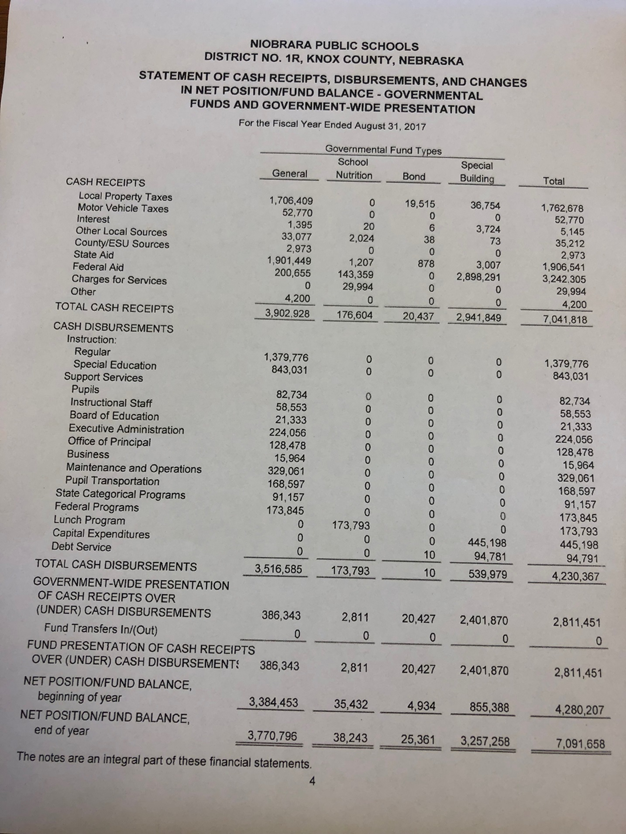
Introduction: This report is required of school districts by the Nebraska State Department of Education for them to be following state accreditation standards. Each district in the state must report specific information to their patrons each year. Mandatory report topics are student progress, demographics, learning climate and finance. The regulation also requires that information be published and available to patrons. If you have any questions about these topics or others, please feel free to contact the school office.
Niobrara Public School is a Class III school district located in Northeast Nebraska along the scenic Niobrara and Missouri Rivers. It serves approximately 240 students over 149 square miles. The student population is reflective of the diverse cultural realm that the district serves. There are significant numbers of American Indian (Santee Sioux and Northern Ponca) students receiving their education at Niobrara Public Schools. The school system has been divided into a PK-5, 6-8 and 9-12 organizational structure. This allows teachers to concentrate on specific content areas with benchmark standards guiding the curriculum. Teachers are able to work with students for three to four years in a content area allowing for greater student success.
|
Nebraska State Accountability : NeSA Scores Percent Proficient: Meets/Exceeds Combined Results for ALL Grades Tested |
||||
|
|
Reading |
Mathematics |
Science |
Writing |
|
2010-2011 |
65 |
56 |
|
|
|
2011-2012 |
71 |
48 |
65 |
|
|
2012-2013 |
63 |
45 |
38 |
57 |
|
2013-2014 |
55 |
47 |
41 |
|
|
2014-2015 |
69 |
48 |
49 |
54 |
|
2015-2016 |
84 |
54 |
59 |
47 |
|
2016-2017 |
|
|
|
|
|
2017-2018 |
|
|
|
|
|
Fall RIT 2011 |
Spring RIT 2012 |
Fall RIT 2012 |
Spring RIT 2013 |
Fall RIT 2013 |
Spring RIT 2014 |
Fall RIT 2014 |
Spring RIT 2015 |
Fall RIT 2015 |
Spring RIT 2016 |
Fall RIT 2016 |
Spring RIT 2017 |
Fall RIT 2017 |
Spring RIT 2018 |
|
|
Grade 3 |
188.8 |
200.8 |
195.9 |
196.1 |
191.9 |
199.2 |
190.8 |
195.9 |
194.1 |
198 |
204 |
|||
|
Grade 4 |
196.6 |
205.3 |
199.8 |
204.4 |
199.7 |
203.3 |
201.2 |
208.5 |
199 |
206.9 |
200 |
202 |
202 |
207 |
|
Grade 5 |
210.9 |
214.1 |
202 |
206.7 |
201.8 |
210.7 |
201.9 |
209.3 |
206.9 |
210 |
205.3 |
209 |
205 |
210 |
|
Grade 6 |
207.5 |
212.3 |
215.4 |
214.4 |
208.2 |
206 |
209.8 |
214.6 |
208.9 |
216.3 |
208.7 |
209 |
209 |
204 |
|
Grade 7 |
211.4 |
221.2 |
210 |
210.7 |
216.2 |
220.1 |
214.2 |
213.3 |
213.2 |
219.4 |
209.5 |
209 |
213 |
216 |
|
Grade 8 |
218.8 |
225.1 |
212.9 |
219.3 |
214.6 |
213.6 |
221.8 |
219.4 |
218.9 |
222.1 |
212.6 |
213 |
218 |
215 |
|
Grade 9 |
217.3 |
225.1 |
212.7 |
220.5 |
217.5 |
223.3 |
218.9 |
218.8 |
223.3 |
226.3 |
212.1 |
215.8 |
221.3 |
220.1 |
|
Grade 10 |
222.1 |
224.9 |
226.8 |
228.3 |
221.3 |
222 |
216.3 |
221.4 |
228.6 |
215 |
221 |
222 |
||
|
Grade 11 |
223.3 |
220.5 |
220.6 |
230.3 |
225.9 |
225 |
228.3 |
231.9 |
232 |
234 |
233 |
|||
|
Below 40th %ile |
||||||||||||||
|
40th-60th %ile |
||||||||||||||
|
Above 60th %ile |
|
|||||||||||||
|
** Blanks indicate class size less than 10 students |
Student Counts as of the Last Friday in September, 2017
|
Grade |
Students |
Grade |
Students |
|
Pre K |
17 |
|
|
|
K |
16 |
07 |
21 |
|
01 |
14 |
08 |
9 |
|
02 |
11 |
09 |
14 |
|
03 |
21 |
10 |
13 |
|
04 |
16 |
11 |
14 |
|
05 |
19 |
12 |
13 |
|
06 |
15 |
12+ |
1 |
|
GRADE BY GRADE STUDENT NUMBERS
Total Students K-12 on Last Friday in September
2012-2013 167 or 185 with Preschool 2013-2014 185 or 203 with Preschool 2014-2015 184 or 198 with Preschool 2015-2016 195 or 208 with Preschool 2016-2017 211 or 225 with Preschool 2017-2018 197 or 214 with Preschool Poverty Percentage History
2012-2013 141/167 = 84% 2013-2014 149/185 = 81% 2014-2015 143/186 = 77% 2015-2016 156/208 = 75% 2016-2017 157/211 = 74% 2017-2018 152/197 = 77% |
.png)